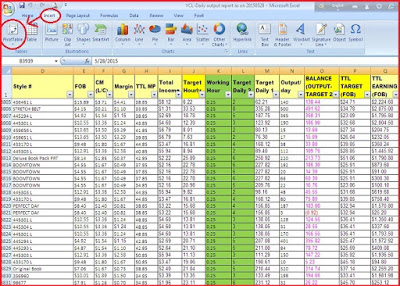
Report making is one of the important tasks for office executives or managers. Top management always desires clear report with a pivot table and graph chart from the subordinate so that they could understand the real situation by watching the report at a glance. He who wish to complete their report clearly and quickly to present high officials, they should have sound knowledge of spreadsheets like MS Excel, Google Doc or Open office for making various reports. If you can learn report making task perfectly, it will help you to manage your daily job more efficiently than your other colleagues. It is one of the regular functions for most of the garment officials in the garment’s industry. Not only garment officials but also other officials have to prepare report in their profession. In my practical experience, I have seen that expertise on MS Excel is a perfect tool to focus your report. Well formulated reports are easy to understand to all to take quick decision.
Use spreadsheet and become smarter in report making!

If you are asked to compile summarized report regarding daily production output (DPO) of a manufacturing company where you have to show line wise, buyer wise, style wise, day wise, month wise output and diagnosis profit or loss in a diverse format, it would be a rough and time killing assignment. If management urges you to do such task, I realize that it is one kind of mental torture upon you. So, how could you get rid of this hassle and swift your daily task?
Got expertise on the spreadsheet may help you to prepare various kinds of reports. There are numerous features in a spreadsheet like pivot table, vlookup, filter, macros, graph chart and thousands of useful shortcut keys assist you to manage your task swiftly.
In this article, I am not going to teach you spreadsheet but just let you know the tremendous features exist in this software that is very helpful to prepare business or official reports. You can accrue it by reading attach file (Excel manual) and continuous practice. I will show an example that I use for making daily production output. Pivot table is a useful feature to make a meaningful report, and it is not very difficult. But many of us do not know how to use pivot table. Please find a google drive link to know how to make a pivot table.
I have attached another google drive link where exists an exercise file on spreadsheet to learn excel perfectly. Please hit the link to download your desired file.
Please download these attach file and practice as much as to enhance your skill. Please note without regular practice you cannot improve your efficiency. I think you will become a pro by practicing these excel manuals.
You may like: Techniques to Improve Garment Quality


Leave a Reply
You must be logged in to post a comment.